In this article, we will learn how to write a bash script to send test automation-related data to Splunk and how to visualize test status on a Splunk dashboard. We will do an example based on a real-world scenario. First, I will explain the test status dashboard requirements, and then we will do the all required operations to show the test status results on a Splunk Dashboard. Curious? Ok then, let’s get started!
Visualize Test Status on a Splunk Dashboard Requirements
First, we should start with the test status dashboard requirements. Our main aim is to show the Pact contract testing statuses on a Splunk Dashboard. In real life, we have many microservices and for each microservices, we need to write consumer and provider contract tests and we want to show the contract testing implementation status report on a Splunk Dashboard. Our dashboard should have one table to show the below fields:
- Service name
- Open API Specification YAML file availability
- API endpoints inside Open API Specification YAML file (Resource Paths)
- Consumer tests availability
- Time (Latest update time)
Also, it should have one single value section to show a total number of services and one pie chart to show contract tests coverage.
Now, we understood the requirements. And now, we should think about how to create a solution for it.
Test Status Visualisation on Splunk Solution
There are many ways to create a solution based on our requirements but in this article, I will share two steps approach. First, we should have a bash script to check the Open Api Specifications file of a microservice and then parse that YAML file to get required fields like service name, endpoints count, etc. Also, we need to check the pact broker to get information about the consumer or the provider tests availability for microservices. After all of these information-gathering steps, we will push these data to Splunk with JSON format. In the second step, we will show these data on a Splunk dashboard. Now, let’s start with the first step.
Creating a Bash Script to Send Contract Testing Status to Splunk
In microservices, each microservice has its own repository and in these repositories’ main package’s resources folder, we keep the Open API Specification (a.k.a Swagger) YAML files. First of all, the Open API Specification YAML files have to be in these folders. Based on your case and your technology stack, these folder names and folder structures may differ. However, you can adapt our solution to your case easily. In our example, our directory structure is shown below.

In the bash script, we first check the Open API Specification YAML file exists or not. If it exists under the “openapi” folder, then we will gather the required information based on our requirements. In order to do all the required operations, we will use the yq which is a YAML query language for YAML parsing, docker to get the consumer and provider tests availability in pact broker, awk to do some text manipulations. I installed all these tools on my machine and you can do the same by visiting their websites and following their installation guidelines.
In the script below, I implemented all required operations to cover our requirements. For each service (in this example we have two services – shopping cart and payment orders), we can run this bash script and send the JSON formatted data to Splunk. Also, you can integrate this script with your Jenkins groovy script or any other CI/CD tool.
#!/bin/bash

endpoints=0
isConsumerTestAvailable="YES"
isProviderTestAvailable="YES"
isContractTestAvailable="YES"
isOASAvailable="YES"
# file=./shopping-carts-service/src/main/resources/openapi/*service.y*ml
file=./payment-orders-service/src/main/resources/openapi/*service.y*ml

# move this env variable to the system config
export PACT_BROKER_BASE_URL=YOUR_PACT_BROKER_BASE_URL
export PACT_BROKER_TOKEN=YOUR_PACT_BROKEN_TOKEN

if [ -f $file ]; then
    # get service name from yaml file
    serviceNameLC=$(yq e '.tags[0].name' $file)
    serviceNameUC=$(echo "${serviceNameLC}" | tr '[:lower:]' '[:upper:]')
    echo "Service name LC:" ${serviceNameLC}
    echo "Service name UC:" ${serviceNameUC}

    # get service endpoints from yaml file
    endpoints=$(yq eval '(.paths | length)' $file)
    echo "Total Endpoints: $endpoints"

    # check consumer pact test availability
    isConsumerPactTestExist=$(docker run --rm -e PACT_BROKER_BASE_URL -e PACT_BROKER_TOKEN pactfoundation/pact-cli:latest broker list-latest-pact-versions | awk 'NR > 2 {print tolower($1)}' | grep "${serviceNameLC}")
    if [ "$isConsumerPactTestExist" != "" ]; then
        echo "${serviceNameLC}: Consumer Pact contract test found in the Pact Broker!"
    else
        isConsumerTestAvailable="NO"
        echo "${serviceNameLC}: No Consumer Pact contract test found in the Pact Broker!"
    fi

    # check provider pact test availability
    isProviderPactTestExist=$(docker run --rm -e PACT_BROKER_BASE_URL -e PACT_BROKER_TOKEN pactfoundation/pact-cli:latest broker list-latest-pact-versions | awk 'NR > 2 {print tolower($5)}' | grep "${serviceNameLC}")
    if [ "$isProviderPactTestExist" != "" ]; then
        echo "${serviceNameLC}: Provider Pact contract test found in the Pact Broker!"
    else
        isProviderTestAvailable="NO"
        echo "${serviceNameLC}: No Provider Pact contract test found in the Pact Broker!"
    fi

    # check contract test availability (either consumer or provider)
    if [ "$isConsumerTestAvailable" == "NO" ] && [ "$isProviderTestAvailable" == "NO" ]; then
        isContractTestAvailable="NO"
        echo "${serviceNameLC}: No Consumer and Provider Pact contract test found in the Pact Broker!"
    fi
else
    isOASAvailable="NO"
    echo "OpenApi Doc not found."
fi

#Sending data to Splunk
curl -k "0/services/collector" \ -H "Authorization: Splunk 8a1b2d23-ba23-4ca8-aa24-8a15658c1f30" \ -d '{"sourcetype": "_json", "event": {"service": "'$serviceNameUC'", "pacts": {"consumer-test": "'$isConsumerTestAvailable'", "provider-test": "'$isProviderTestAvailable'", "contract-test": "'$isContractTestAvailable'"}, "OAS": {"available": "'$isOASAvailable'", "endpoints": "'$endpoints'"}}}'

#Debug line to see the JSON Data
echo '{"service": "'$serviceNameLC'", "pacts": {"consumer-test": "'$isConsumerTestAvailable'", "provider-test": "'$isProviderTestAvailable'", "contract-test": "'$isContractTestAvailable'"}, "OAS": {"available": "'$isOASAvailable'", "endpoints": "'$endpoints'"}}'
Note: This script is written based on our requirements and open API specification implementations. In your case, you may do some modifications in your bash script.
When we run this bash script on our machines, we will see the below result. (Note: I have already installed Splunk on my machine that’s why sending the JSON data to Splunk part did not fail in my case. We will install Splunk on our machines in the second part of this solution.)
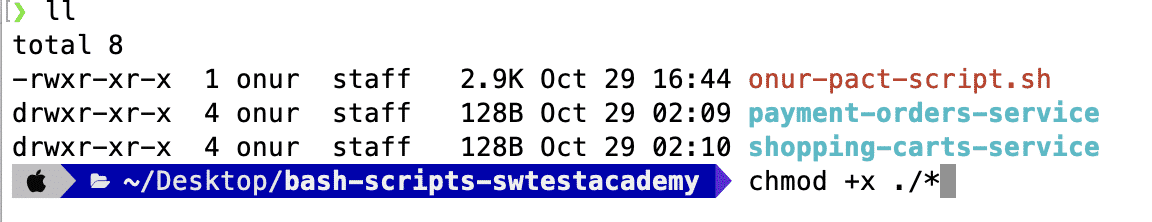
First, we need to set the access rights with the chmod command below:
chmod +x ./*
Now, we can run our script as shown below.

We can comment the shopping cart service file line and uncomment payment orders service file line, and re-run the script for payment orders service.

As you can see on the screenshots, our bash script runs successfully. We completed the first part of the solution. Now, we can install Splunk on our machines to create a test status dashboard.
Creating a Splunk Dashboard to Visualize the Test Status
In the second part of our solution, we will install Splunk on our machines and then create a Test Status Dashboard based on our initial requirements.
First, let’s go to the Splunk download page and install it on your operating system. Click the free button, fill the form, and then download the Splunk based on your operating system.


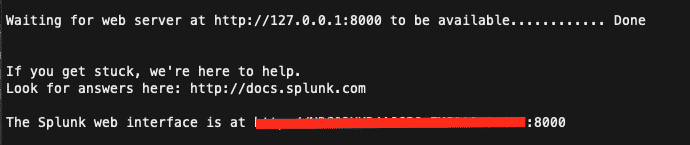
After installation, we should run the Splunk server start command which is shown below, and if there is a port problem, you can set a different port for the Splunk server.
/Applications/Splunk/bin/splunk start

And after the below step, we can reach Splunk on localhost:8000
When we go to the localhost:8000, we will see the Splunk login screen. We should enter the username and password which we defined in previous steps for logging in to Splunk.

After login to Splunk, click to “Search & Reporting“.

Then, click to Dashboards -> Create New Dashboard

Then, we can either create a Classic Dashboard or we can select the Dashboard Studio. In this case, I just clicked the Classic Dashboard.

Then, we can add the panel items to create our dashboard. In our dashboard, we will have a Statistics Table to show all details based on our requirements, a Single Value to show the service count and Pie Chart for test coverage.

After adding these panel elements, click the search icon of each panel element and then add the codes which are shown below for each panel element.

For Statistics Table we should add the code below:
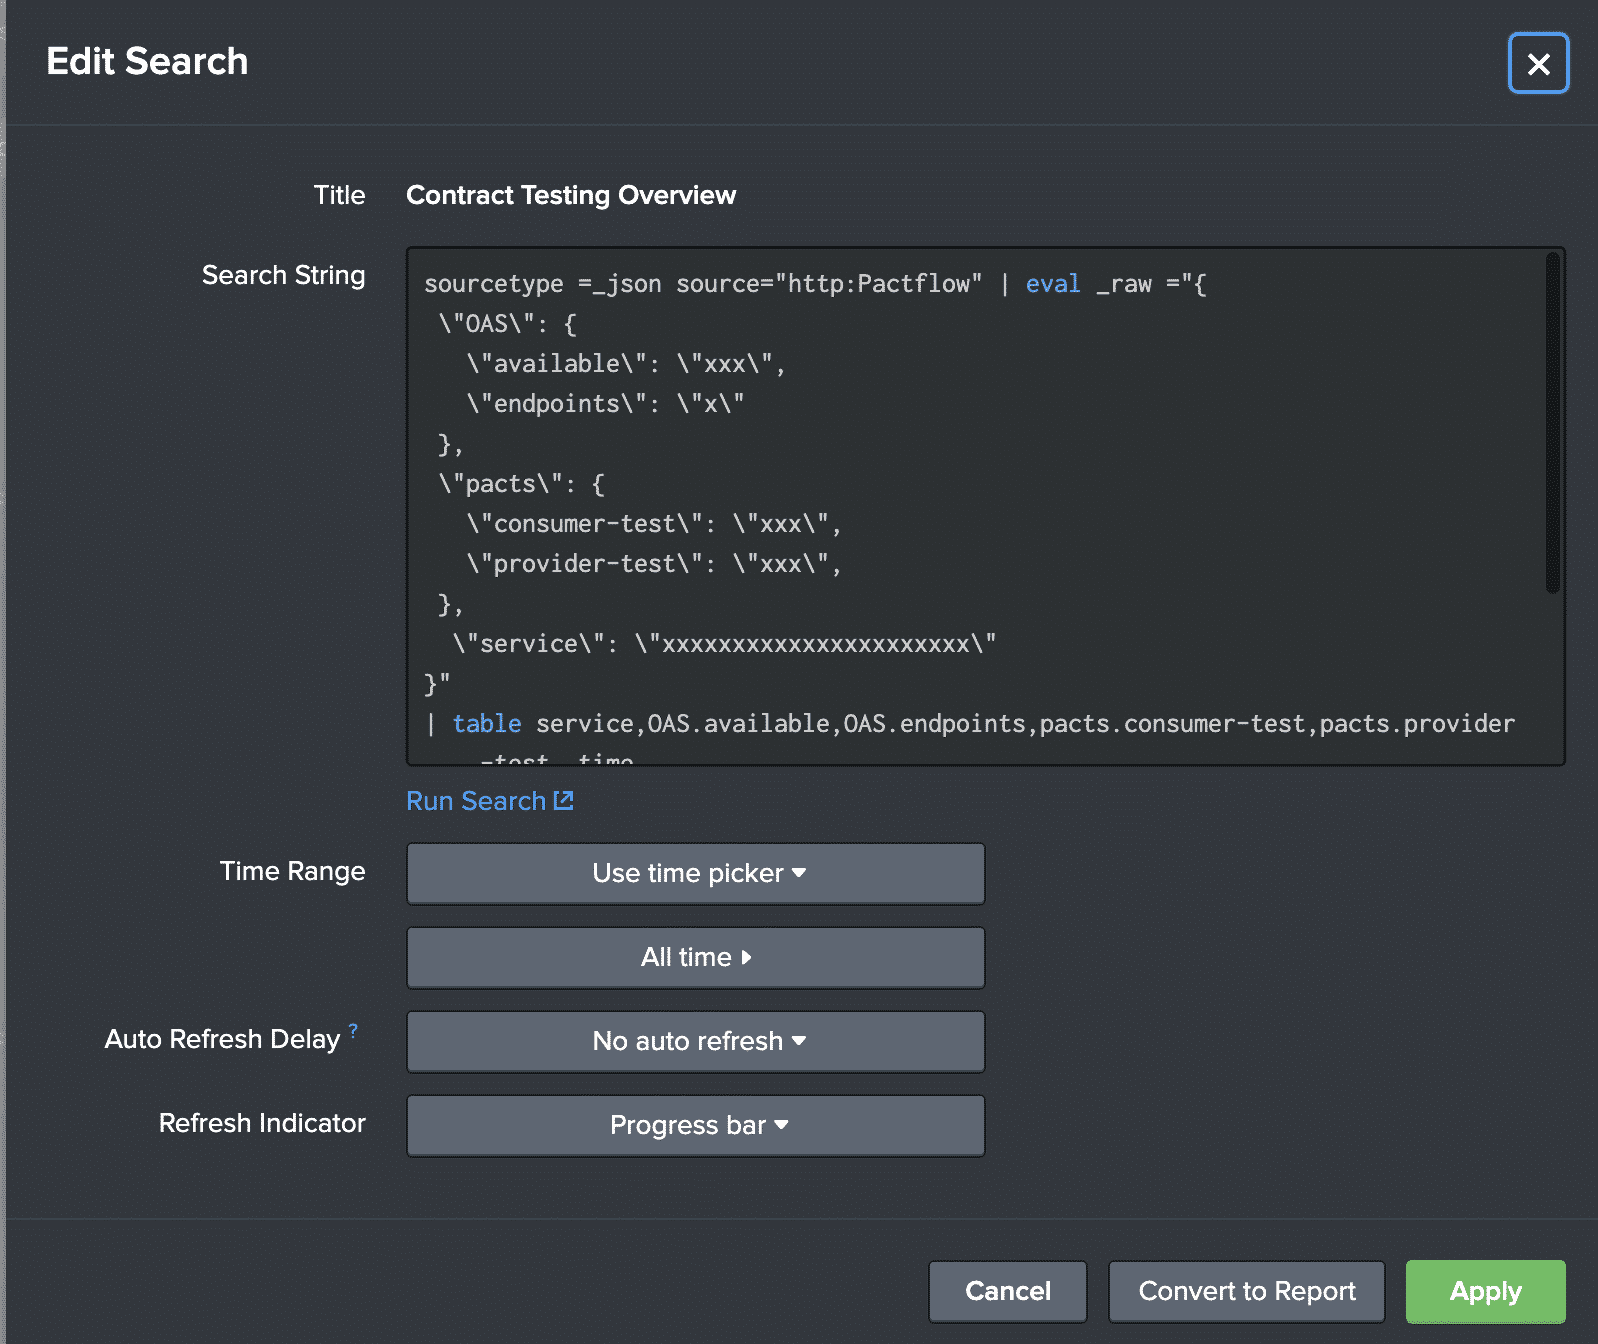
sourcetype =_json source="http:Pactflow" | eval _raw ="{
 \"OAS\": {
   \"available\": \"xxx\",
   \"endpoints\": \"x\"
 },
 \"pacts\": {
   \"consumer-test\": \"xxx\",
   \"provider-test\": \"xxx\",
 },
  \"service\": \"xxxxxxxxxxxxxxxxxxxxxx\"
}"
| table service,OAS.available,OAS.endpoints,pacts.consumer-test,pacts.provider-test,_time
| rename OAS.available as "OAS Exist?"
| rename OAS.endpoints as "Api Endpoints"
| rename pacts.consumer-test as "Consumer Test Exist?"
| rename pacts.provider-test as "Provider Test Exist?"
| sort - _time asc
| dedup 1 service
For service count we should add below one:
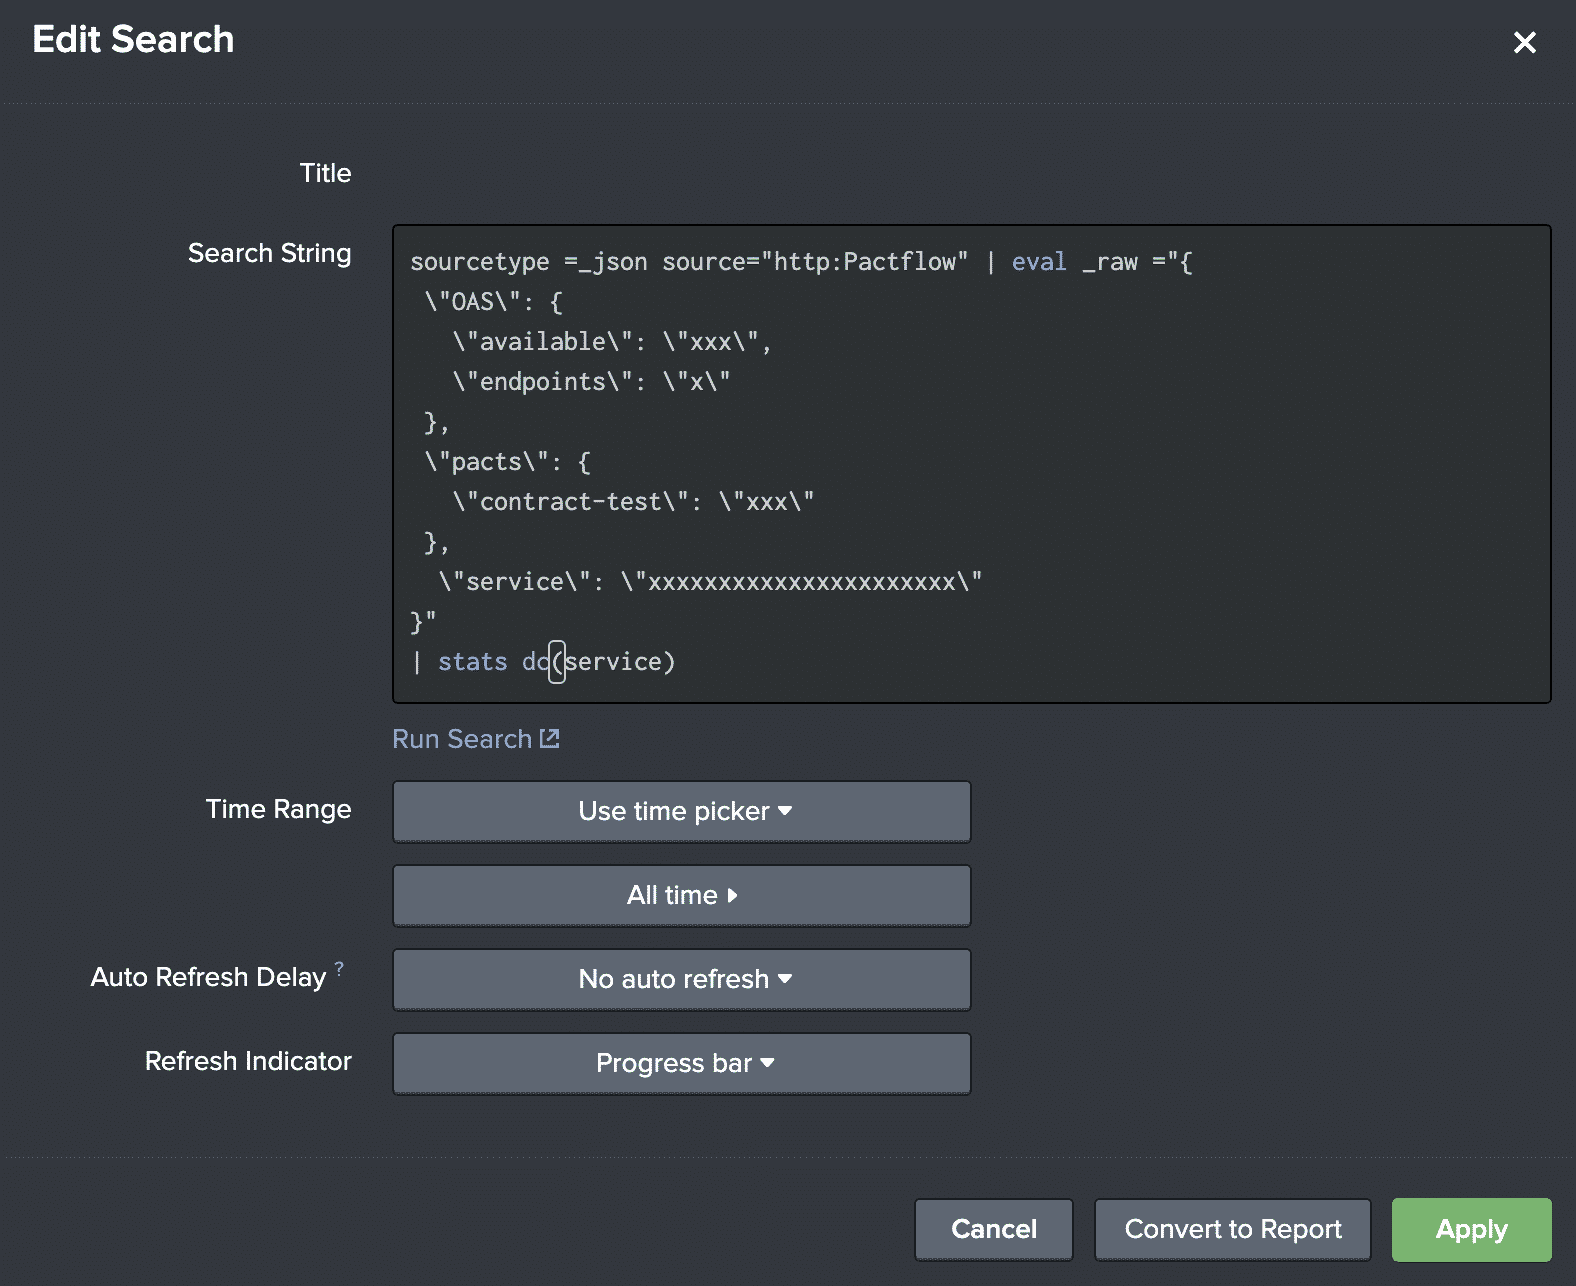
sourcetype =_json source="http:Pactflow" | eval _raw ="{
 \"OAS\": {
   \"available\": \"xxx\",
   \"endpoints\": \"x\"
 },
 \"pacts\": {
   \"contract-test\": \"xxx\"
 },
  \"service\": \"xxxxxxxxxxxxxxxxxxxxxx\"
}"
| stats dc(service)
and for the Pact Test Coverage we should add the below code:

sourcetype =_json source="http:Pactflow" | eval _raw ="{
 \"OAS\": {
   \"available\": \"xxx\",
   \"requests\": \"x\"
 },
 \"pacts\": {
   \"contract-test\": \"xxx\"
 },
  \"service\": \"xxxxxxxxxxxxxxxxxxxxxx\"
}"
| stats latest(pacts.contract-test) by service
| chart count by latest(pacts.contract-test)
After these steps let’s save the dashboard. Now, we need to do data input settings to get data from the bash script.
Splunk Data Input Settings
In order to process the data from the bash script on Splunk, we should have a data input. For this, click Settings -> Data Inputs

Then, click the “HTTP Event Collector” to create an event collector.

After, click the “New Token”.

Do the settings as seen on the screenshot below. Here our data Source Type must be “_json” and “Enable Indexer acknowledgment” must be unchecked.

And Global Settings should be like below.

Our pactflow data input will look like as seen in the screenshot below.

How to Delete the Source Data in Splunk
If you push some unwanted data to Splunk, you can easily delete them. First, go to the Settings -> Users -> your user and give yourself a delete right.

Then, you can delete your source’s data by running the command below on the search bar.
source="http:pactflow" | delete

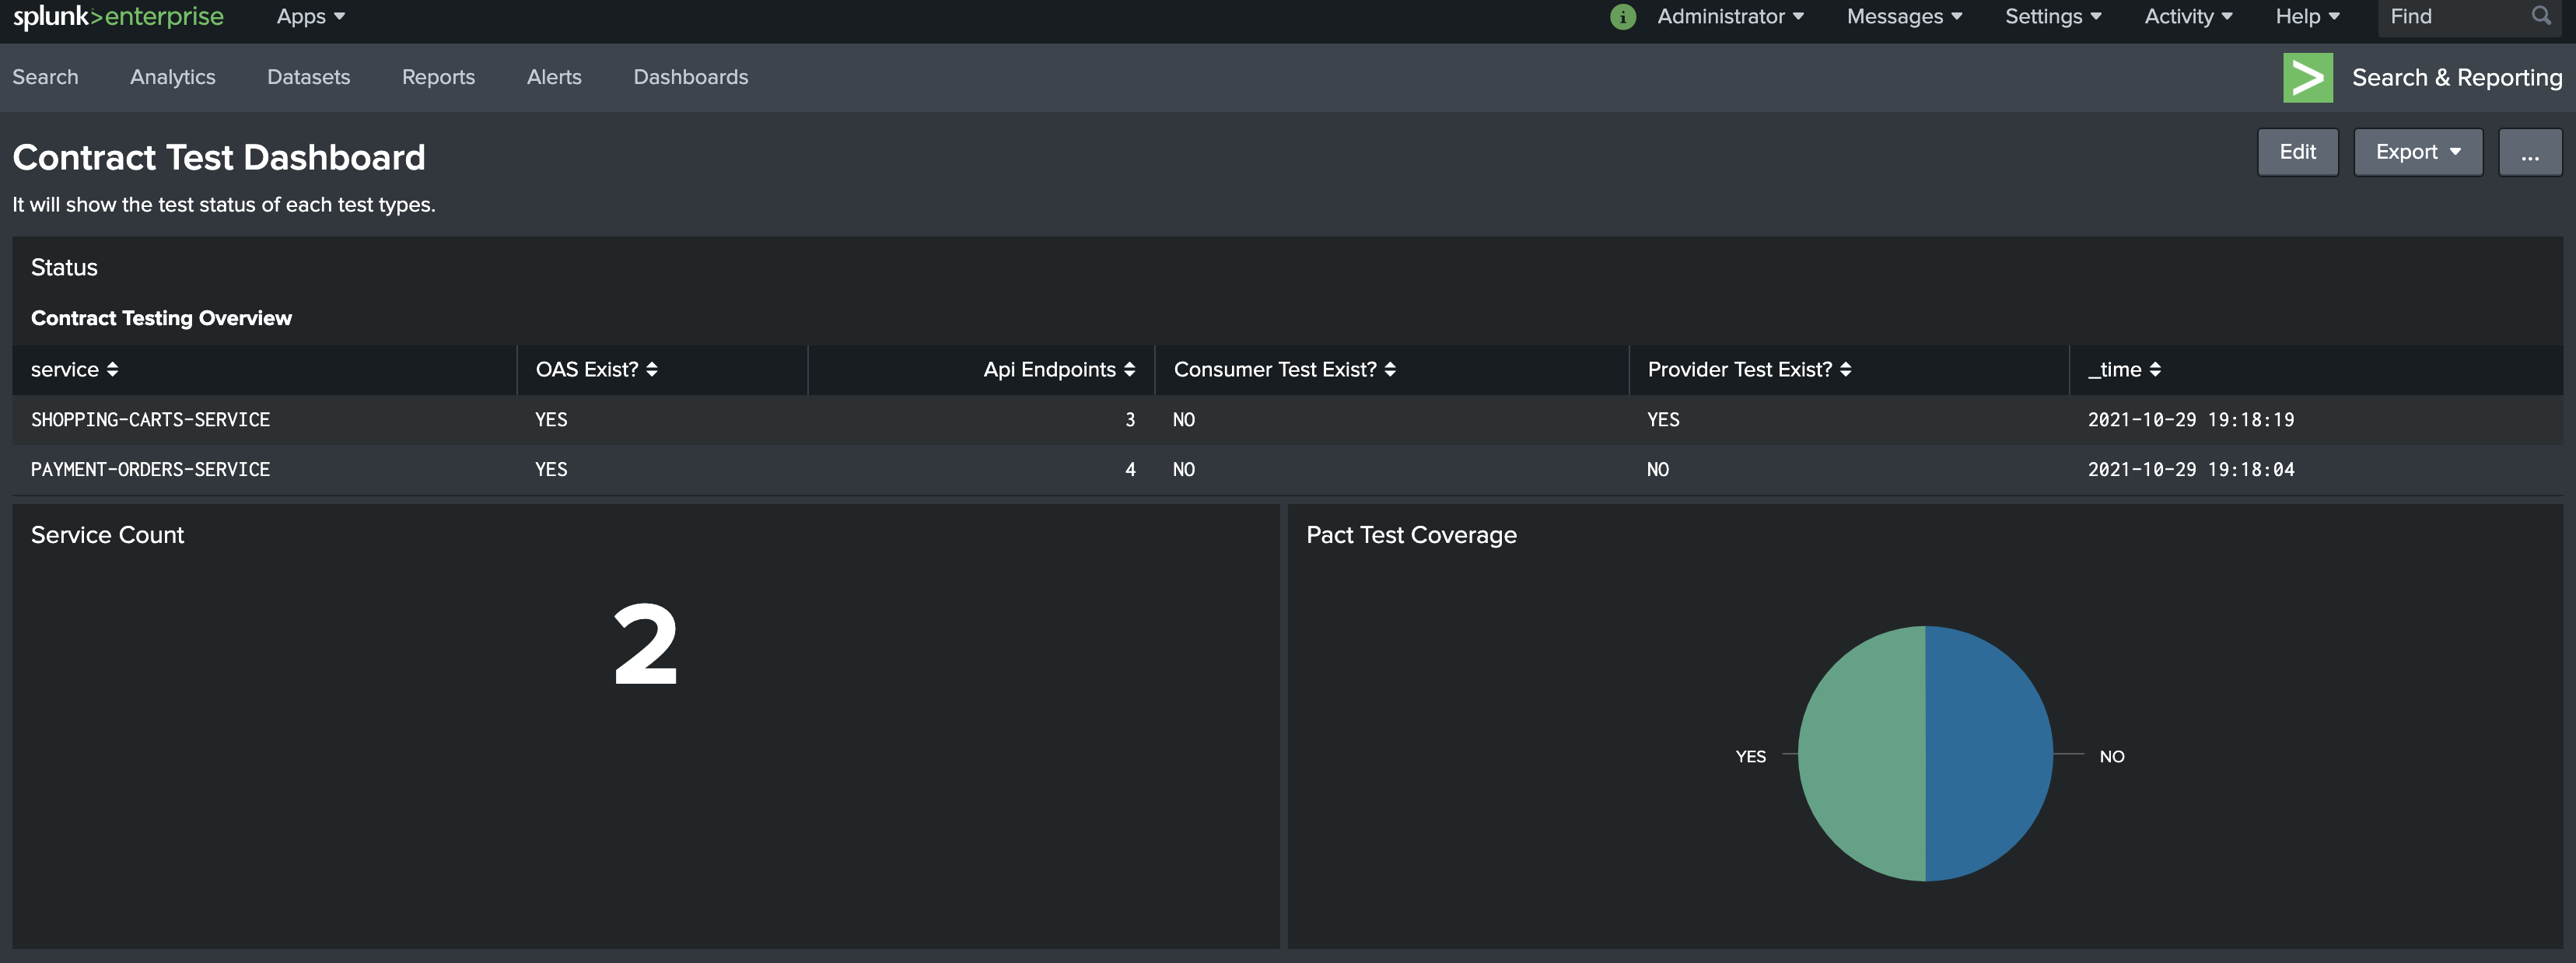
Test Status Dashboard on Splunk
After the Splunk-related settings and bash script creation, you can run your bash script and check the results on your Splunk dashboard.
First, I run the bash script for the shopping cart and payment orders service as seen below.

Then, go to the Splunk Dashboard and see the results as shown in the screenshot below.
In this article, I explained how to create a test status dashboard on Splunk, I hope you enjoyed reading it.
See you in another article,
Onur Baskirt

Onur Baskirt is a Software Engineering Leader with international experience in world-class companies. Now, he is a Software Engineering Lead at Emirates Airlines in Dubai.